Supply Chain 3.0 Is Real
When I explain to people that supply chain 3.0 is real, in general, I get three type of responses. Most of the McKinsey (or their clone) trained strategists ask me to show data to back up this assertion. On the other hand, more intuitive executives (mainly from sales and marketing background, as I observe) ask me to explain the benefits of supply chain 3.0. Finally, the third group – those who I call the transformational leaders ask a simple question – how can we use the power of supply chain 3.0 in effecting beneficial business transformations.
In this blog I will address the first question. I will leave for later blogs the remaining two questions and other arising questions such as:
how does supply chain 3.0 differ from the previous versions of supply chains, and, why it was even necessary to ‘invent’ supply chains in the first place.
It is an important question – “where is the data to clearly demonstrate that Supply Chain 3.0 is real?”
The data driven crowd has a legitimate concern lest a couple of isolated examples be seen as heralding a trend.
Having trained at a similar top-tier consulting house during my formative years in consulting, I fully understand and endorse their questions. Why?
Because all of us have seen people taking isolated instances and exceptions and making them so big in their own and others’ perceptions that these appear to be the predominant trends.
Nay-sayers will take a few stray instances of setbacks, blow them out proportion to support their naysaying.
On the other hand, almost all investment projects also have their share of overly optimistic projectionists. In the end, only data reveals the overall picture and clarifies the confusion.
About Supply Chain 3.0
For this reason, when I wrote the book “The 5-STAR Business Network“, our team did a 6 year longitudinal study of the top 1200 corporations around the world. There were other reasons why this study was conducted – which are given in Chapter 14 of the book. The full research methodology and the resulting ranking of the companies is also given in the book,
but for our purpose here it is interesting to note that 62 companies out of the entire starting sample of the top 1200 companies in the world scored 20 points out of 25, which is our cut-off for the Supply Chain 3.0.
Also, interesting to note is that Apple – the darling of supply chain crowd – is only ranked #60 in the rankings. And, due to its low margins, Amazon – just missed the cut.
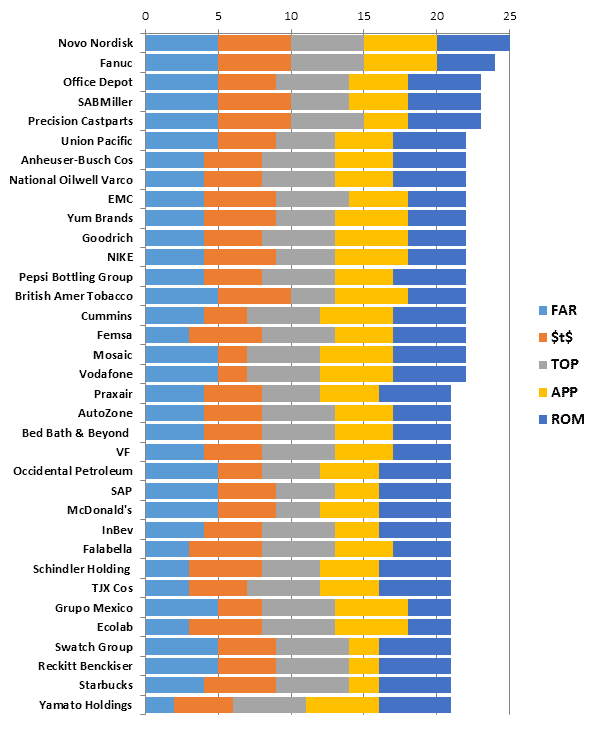
So who are the top 35 companies in these rankings? You can see them in figure 1 below. For the time being ignore the 5 colour coding, as well as funny three-letter acronyms (TLAs) in the figure.
I am absolutely sure, that this figure is unlike any other figure you might have seen before.
Firstly, the companies themselves come from around the globe – Novo Nordisk is from Denmark while Fanuc is from Japan and Falabella is from Chile.
That was to be expected – if you make your research wide and deep enough you will find good companies everywhere. No country, or continent has monopoly on excellence.
So much for all the hype about the Asian century. Sure, development in Asia is creating unprecedented opportunities – but good companies around the globe are using that trend to their benefit.
You do not need to be an Asian company to be excellent, but neither are all non-Asian companies uniformly good.
35 Companies Ranking list of Supply Chain 3.0 Is

Figure 1: Top 35 companies out of the 62 companies with Supply Chain 3.0
Secondly, because this ranking is based on study conducted over 5 years (not at a single point in time) the standards of excellence are much higher.
Also, this is a global study hence the sample base was much wider. For this reason many of the usual suspects that you might have seen elsewhere in magic circles etc. are missing.
Another reason, the usual suspects might be missing is because we looked far beyond tactical operations into the strategic contribution of supply chains to corporate results.
For example, rarely has anyone tried to gauge the impact of supply chain collaboration on innovation, new product development, pipeline of products, product phasing etc.
But in our research, we took these into account.
or details of the research methodology, caveats, cautions and warnings about not applying these results for investment decision making please read Chapter 14 of the book “The 5-STAR Business Network“.
This is critical because I do not want you to take the results out of context and make decision based on flawed assumptions. Time has come to talk about the 5 funny acronyms in the figure.
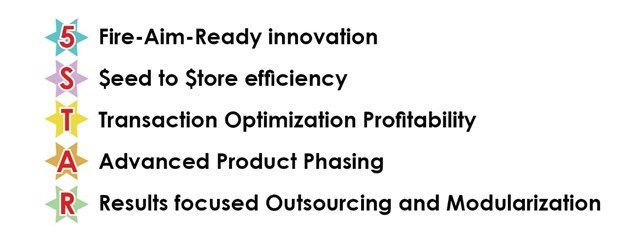
This is because we want to see how these are linked to the strategic contribution of supply chain management to overall corporate results. So, what do these TLAs stand for?
5 Way to Supply Chain 3.0

Figure 2: Five cornerstones of Supply Chain 3.0
Each of these names are quite self-explanatory and most people reading this blog will not need too much explanation.
I will only briefly outline them here, because detailed explanation and examples mean that I will be recreating the book “The 5-STAR Business Network” or a version of it in this blog.
One more important conclusion needs to be drawn from the data presented in Figure 1. You will notice that rarely is there a company which ranks high on each of the five key cornerstones of supply chain 3.0.
Yet, all the 62 excellent companies that meet our criteria for supply chain 3.0 excel in at least three of the five key cornerstones.
That shows you do not have to perfect to arrive at supply chain 3.0 – you only need spikes of excellence in at least three of the five key areas.
In the next two entries, I will write about each of these five pillars in more details.


